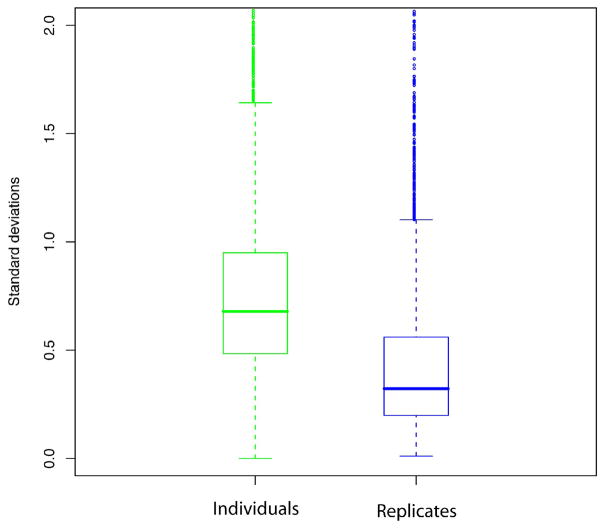
Figure 4.
Distribution of standard deviation for the intensity of the aligned features across individuals in the same group (i.e. cancer and normal) (green) and across technical replicates (blue), for 3 replicate LC-MS runs of each 20 samples. The horizontal line represents the median value, and the upper and lower edges of the boxes represent the 75 and 25 percentile data points, respectively.

