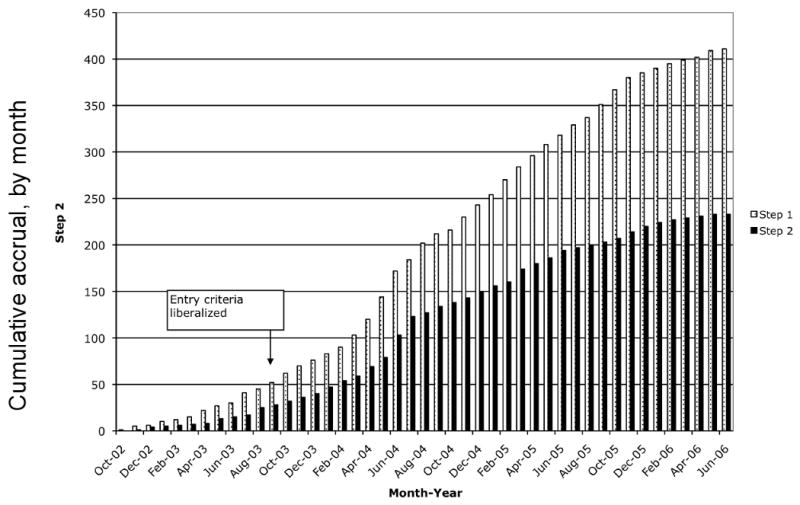
Figure 4. A5146 accrual.

The graph illustrates the accrual, by month, of study subjects into A5146. X-axis, month of accrual; Y-axis, number of study subjects. Gray bars, Step 1 accrual; black bars, Step 2 accrual. Arrow points to the month in which the revised protocol with liberalized entry criteria was released to the sites. The lag in time to increased rates of accrual was due in large part to the time needed for each site to obtain IRB approval.
