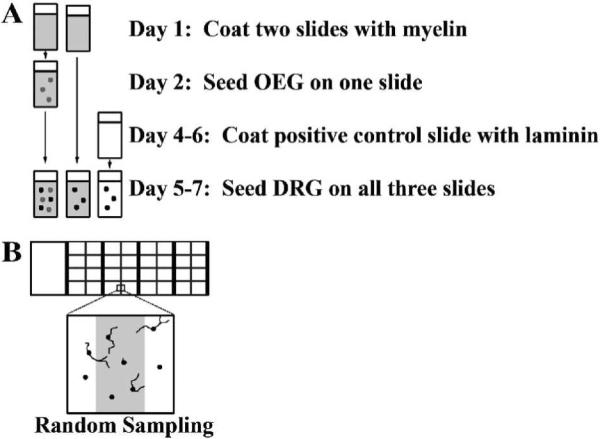
Figure 1. Schematic diagram of slide preparation (A) and analysis of the OEG/DRG inhibitory assay (B).

A: Time line illustrates the sequence of the culture slide preparation, and seeding of OEG and DRG. After a 24 hour growth period cultures were fixed and analyzed.
B: Only neurons with cell bodies on the designated lines were counted and their longest axons measured. Four neurons would be analyzed in this example.
