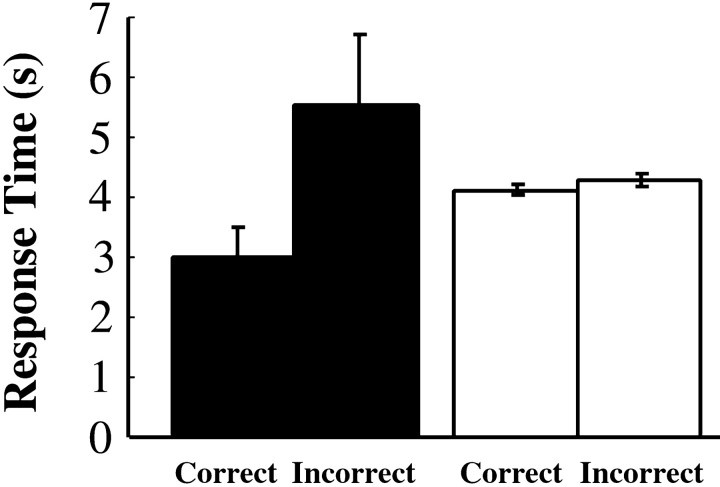
Fig. 2.
Response latencies for correct and incorrect choices in the forced-choice recognition test. For controls (black bars, n = 4), the score was the mean latency for correct and incorrect responses on the 48-item test. Brackets show the SEM of the four scores. For E.P. (open bars), the score was his mean latency across all six forced-choice tests (T1–T6). Error bars show SEM for all his responses.

