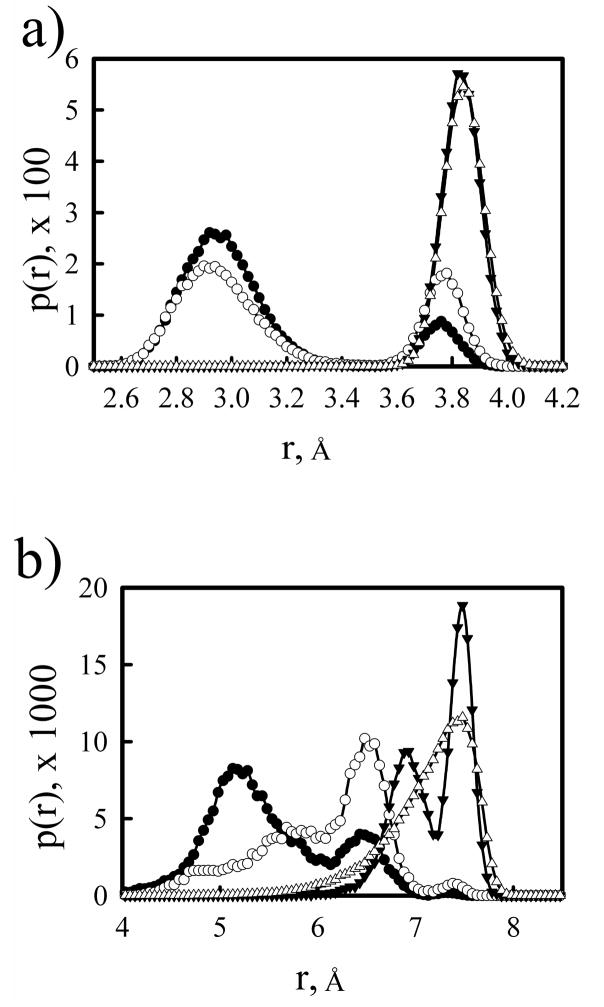
Figure 3.
Distribution of distances between nearest neighbor (a) and next nearest neighbor (b) amine groups from atomistic molecular dynamics simulations of a 20-mer PEI with no amines protonated (open circles), every other amine protonated (filled circles), and all amines protonated (filled triangles) and from Monte Carlo simulations of a coarse-grained PEI model (open triangles).

