Figure 2.
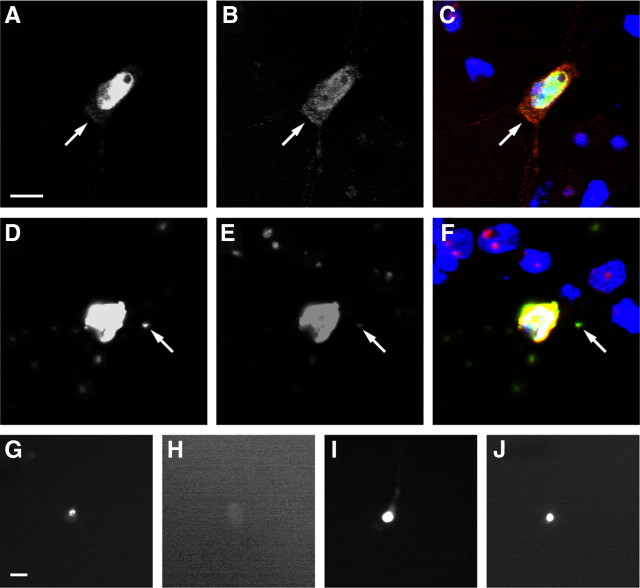
Expression of TDP43-EGFP in primary cortical neurons recapitulates key features of TDP43-proteinopathies. A–C, Diffuse cytoplasmic TDP43-EGFP (arrow) was noted in a fraction of neurons expressing either WT or mutant TDP43-EGFP. D–F, Aggregates (arrow) were observed in a small proportion of neurons transfected with WT or mutant TDP43-EGFP. G–J, Detergent-resistance assay. Cells displaying aggregates were fixed and imaged using fluorescence microscopy before (G, I) and after (H, J) detergent treatment. EGFP fluorescence from TDP43(WT)-EGFP aggregates (G, H) was destroyed by detergent treatment; fluorescence from TDP43(A315T)-EGFP aggregates (I, J) was resistant. A, D, G–J, EGFP fluorescence. B, E, TDP-43 immunofluorescence. C, F, Merged images with Hoechst nuclear staining in blue, EGFP fluorescence in green, TDP-43 immunofluorescence in red, and overlap in yellow. The neurons in A–C and G and H were transfected with TDP43(WT)-EGFP; cells in D–F, I, and J were transfected with TDP43(A315T)-EGFP. Scale bars: A (for A–F), G (for G–J), 10 μm.

