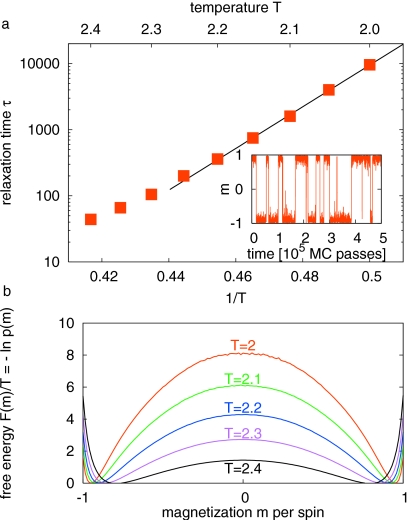
Figure 1.
Magnetization of the 12×12 2D Ising model. (a) Arrhenius plot of relaxation time τ(T) of magnetization m in units of MC passes vs 1∕T. Symbols: MC data; line: Arrhenius fit. Inset: MC trajectory segment of the reduced magnetization m(t) at T=2. (b) Free energy profileF(m)∕T=−ln p(m) of the reduced magnetization m at temperaturesT=2,2.1,…,2.4 (top to bottom at m=0).

