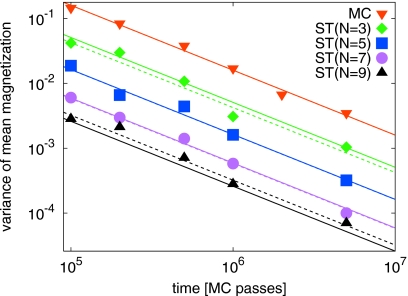
Figure 2.
Variance in the estimator of the mean magnetization as a function of the simulation length tsim measured in units of MC passes. The symbols show the results of a regular MC simulation (top, inverted triangles) and ST simulations with N=3, 5, 7, and 9 temperatures (top to bottom) and corresponding upper temperatures TN=2.1, 2.2, 2.3, and 2.4. The solid lines are the theoretical predictions, cN∕tsim, with cN=(⟨m⟩+−⟨m⟩−)2var(x1)=⟨2|m|⟩2var(x1) and defined in Eq. 8 for the MC data (N=1) and in Eq. 17 for the ST data (N>1). The dashed lines are fits of cN∕tsim. Note that for N=9, the actual error is slightly larger than predicted.

