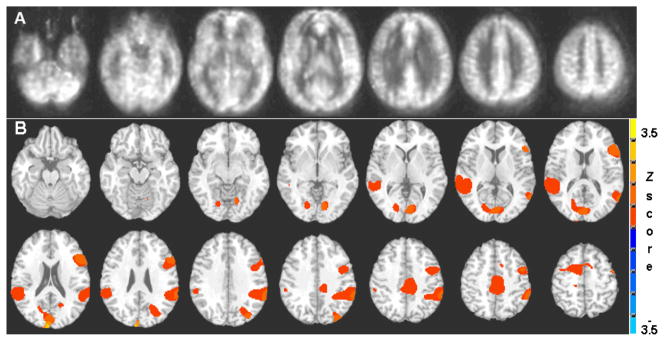
Figure 1.
Group averaged cerebral blood flow (CBF) maps from all subjects (n=15) shows the quality of the quantitative perfusion images using arterial spin labeling technique (A). The BOLD fMRI group activation map (B) for PV > NV (p<0.05 corrected for multiple comparisons) shows bilateral activation of the superior temporal gyrus and inferior parietal lobule, bilateral posterior cingulate cortices, right superior frontal sulcus and postcentral gyrus.

