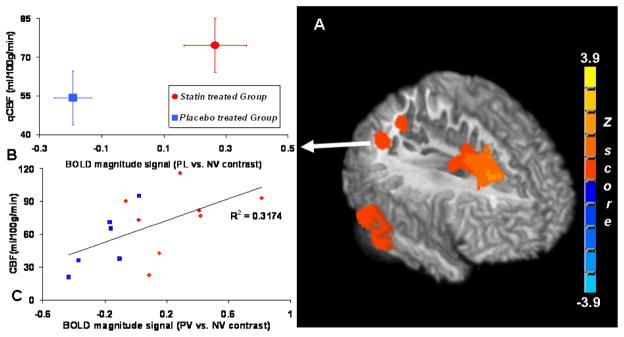
Figure 2.
3D-Surface rendering with middle sagittal view (A) of the significant areas in two sample t-tests where the statin treated group shows significantly greater BOLD canonical signal change than the placebo treated group during the face recognition task (PV > NV) in the right prefrontal and superior frontal sulcus, right inferior parietal lobules, and right angular gyrus. The voxel based comparisons were limited to the brain areas activated by the memory task and a group level threshold p<0.05 (voxel-level threshold of p<0.005 was chosen with cluster size correction for multiple comparisons). (B). Group averaged BOLD signal change and resting qCBF values from the area of the right angular gyrus are plotted. (C). Scatter plot depicts the linear correlation (cross correlation coefficient = 0.56) between BOLD magnitude contrast signal (PV vs. NV) and the baseline CBF values at right angular gyrus across all the subjects in this study.

