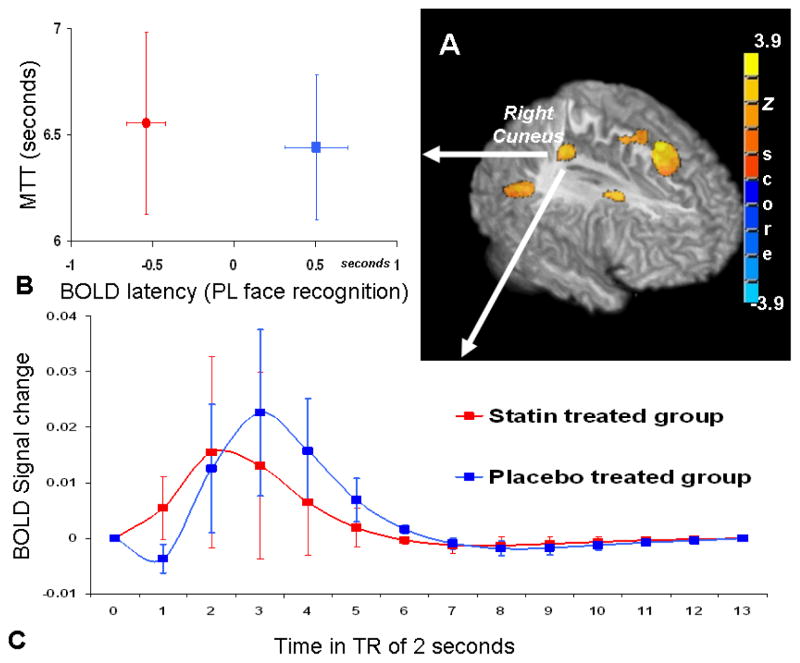
Figure 3.
3D rendering (A) of the significant areas in two sample t-tests where the statin treated group shows significantly faster hemodynamic signal change than the placebo treated group during the PV face recognition task. The group comparison threshold of p<0.05 (p<0.005 at voxel level with cluster size correction) was chosen, corrected for multiple comparisons and the analysis was restricted to the brain areas activated by the memory task. Within the right cuneus area, averaged BOLD latency values are plotted with the resting perfusion mean transit time (B); and the averaged BOLD hemodynamic response time course shows the BOLD signal peak from statin treated group occurs earlier than the placebo treated group (C).

