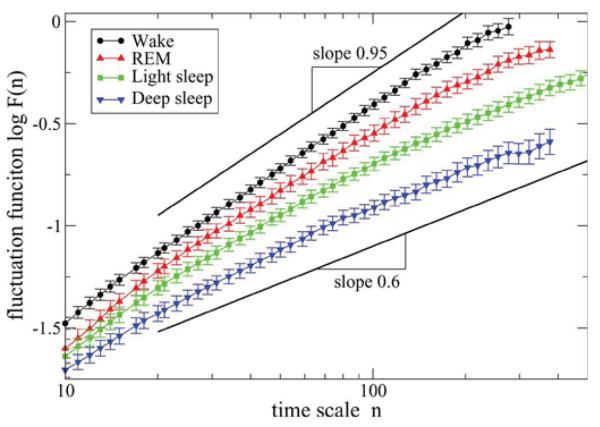
Fig. 3.
Log–log plots of the group average fluctuation functions F (n) versus time scale n (measured in beats) for group of young subjects using DFA-2 analysis of the heartbeat intervals RR during different sleep stages. Scaling curves F (n) for all sleep stages indicate presence of long-range power-law correlations characterized by scaling exponent α over a broad range of time scales. The exponent varies from α ≈ 1 for wake (indicating strong correlations) to α ≈ 0.6 for deep sleep (week correlations) suggesting different fractal temporal organization in heartbeat fluctuations during different sleep stages. Error bars represent the standard error. The scaling curves F (n) are vertically offset for clarity. As the durations of different stages vary among subjects and thus the maximum time scale nmax of the DFA analysis may be different for different subjects, only F (n) data points averaged over at least 14 recordings are presented for each stage.

