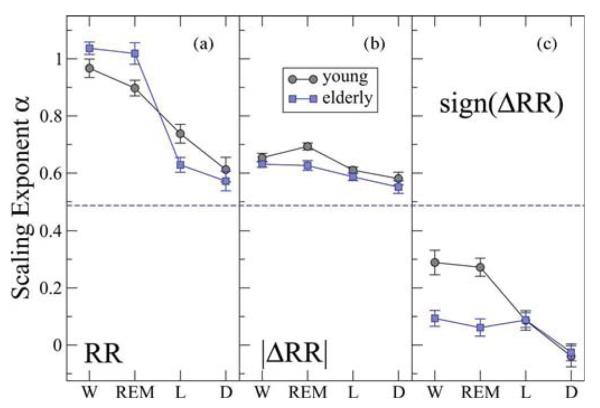
Fig. 4.
Scale-invariant dynamic measures of heart rate variability across sleep stages for young and elderly. (a) Group average scaling exponent α for the time series of heartbeat intervals RR exhibits a pronounced and statistically significant stratification across sleep stages for both young and elderly. High degree of fractal correlations is observed during wake an REM with α ≈ 1 and much weaker correlations during light and deep sleep with α ≈ 0.6. Uncorrelated (white noise) behavior with α = 0.5 is indicated by a dashed line. (b) Group average scaling exponent αmag for the time series of |ΔRR|. Both young and elderly exhibit long-term nonlinear behavior with αmag > 0.5 and with a very similar stratification pattern across all stages: higher αmag-values and higher degree of nonlinearity during wake and REM; lower αmag-values and closer to linear behavior during light and deep sleep. (c) Group average scaling exponent αsign for the time series of sign(ΔRR). A statistically significant stratification pattern with decreasing values of αsign across all stages is observed for the young group. Elderly subjects exhibit a different pattern with significantly lower values of αsign during wake and REM (see Table I). Data are obtained after fitting the DFA scaling curves F (n) for each individual recording in the range of time scales: n ∈ [50, 250] beats for α; n ∈ [10, 150] for αmag; and n ∈ [7, 13] for αsign. Error bars represent the standard error.

