
FIGURE 1.
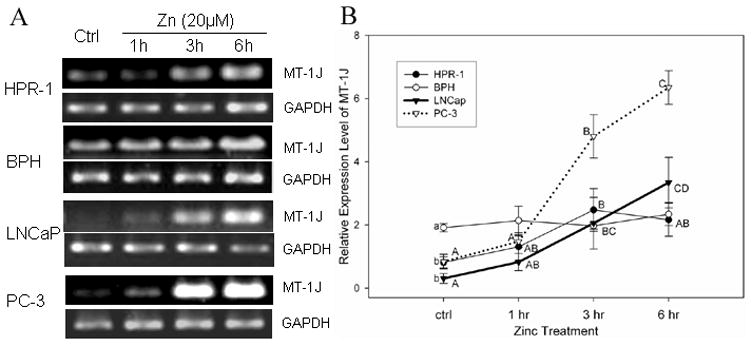
Time course study of zinc-induced MT-1J mRNA levels in prostate cells detected by semi-quantitative RT-PCR. Cells were incubated with or without zinc (20 μM) for different times, as indicated. A. RT- PCR products of MT-1J and GAPDH were analyzed by gel electrophoresis. B. MT-1J mRNA levels are expressed by the MT-1J relative optical densities normalized by related GAPDH signals. Each denoted point and bar represent the mean ± SE (n=3). A significant difference (p≤0.05, LSD) between samples from different time point in each cell line is indicated with different capitalized letters (A,B,C,D). A significant difference (p≤0.05, LSD) of the endogenous levels of MT-isotypes among four cell lines is denoted with different lowercase letters (a,b,c). The same illustration for the statistical significance analysis is used in Figure 2 and 3.