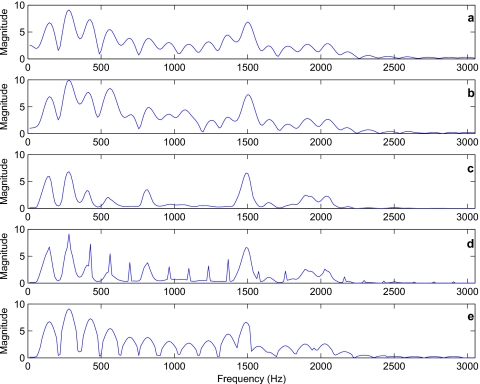
Figure 4.
Example FFT magnitude spectra (displayed in linear units) of a voiced segment extracted from a sentence (for better clarity, only the spectrum spanning the frequency range 0–3 kHz is displayed). The top panel shows the clean speech spectrum. The second panel shows the noisy speech spectrum (SNR=0 dB) and the third panel shows the enhanced speech spectrum after applying the logMMSE noise-reduction algorithm. The fourth panel shows the harmonics-regenerated speech spectrum based only on the main harmonics occurring at multiples of F0. The bottom panel shows the harmonics-regenerated speech spectrum based on both the main harmonics and adjacent partials.

