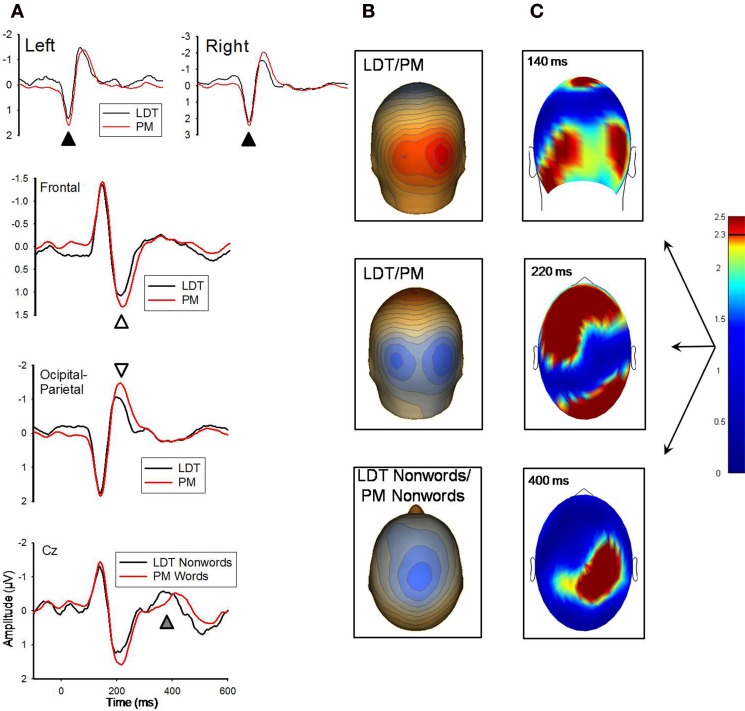
Figure 2.
(A) Grand-averaged ERP waveforms for LDT-words/nonwords and PM-words/nonwords for the 140 ms (marked with black arrow) and 220 ms (white arrow) components. ERP waveforms depicting the 140 and 220 ms effects were derived by averaging sensors from significant clusters that resulted from the respective planned contrasts. The bottom panel depicts ERP waveforms for LDT-nonwords and PM-nonwords for the 400 ms (gray arrow) component, and these waveforms were derived from electrode Cz which best represented the difference around 400 ms. Negative is plotted up. (B) Topographical voltage distributions averaged within time windows centered on the peak latency of each component for which there were significant effects. Positive isopotential lines are in red, negative isopotential lines are in blue. Isopotential line scales are: 0.9 μV/step for 140 ms, 0.67 μV/step for 220 ms, and 0.32 μV/step for 400 ms components. Due to similarities in topographies between conditions, LDT-items and PM-items are averaged and presented on one voltage topography for the 140 and 220 ms effects, and LDT-nonwords and PM-nonwords are averaged and presented on one voltage topography for the 400 ms effect. (C) Plots of t-values (absolute value taken) over the head surface indicate the sensor clusters for which there were significant effects between LDT-items and PM-items at peaks 140 and 220 ms post-stimulus, and between LDT-nonwords and PM-nonwords at 400 ms post-stimulus. The critical t-value (t = 2.3281) is marked on the scale.

