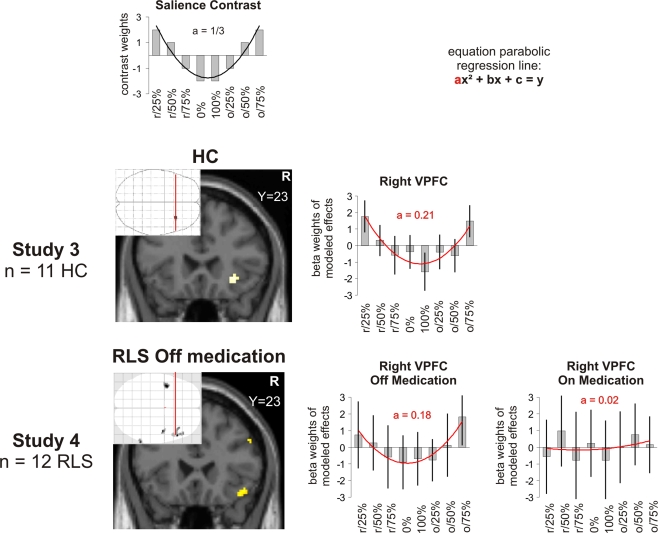
Figure 3.
Salience in outcome (reward probability). Brain activation and beta weights in the right VLPFC/anterior insula as found for the contrast modelling salience scanned during the probability paradigm. Study 3 was performed in healthy controls (HC), study 4 in patients with RLS off and on their regular medication. The beta values were extracted from the maximum voxel of the demonstrated activation. The map was thresholded at p < 0.005 FWE corrected for healthy controls and at p < 0.001 at the voxel-level and at an extent threshold of p < 0.05 at the cluster-level in patients. The coefficient “a” taken as a measure of the shape of a U-shaped regression curve indicates a more shallow curve the lower the levels in healthy controls. In RLS patients on regular medication, the coefficient “a” taken as a measure of the shape of a U-shaped regression curve indicates a trend (p = 0.06) towards a more shallow curve. r/25%, r/50%, r/75%, 0%, 100%, o/25%, o/50%, o75%: receipt (r) or omission (o) of reward expected at 0%, 25%, 50%, 75% or 100%.

