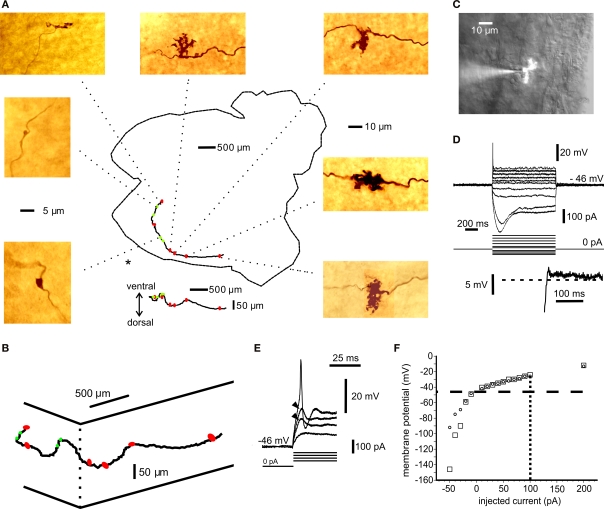
Figure 1.
Anatomical and electrophysiological identification of mossy fibres. (A) Montage of a mossy fibre trajectory in the whole-cerebellum preparation. The axon was injected with biocytin and reacted with DAB. The cerebellum is viewed from the ventral (ependymal) side. The cerebellar outline is indicated, including the cerebellar peduncles (right). The caudal tip (to the left) has been cut in two with a small sagittal incision to facilitate flattening of the tissue during fixation. The axon was traced using Neurolucida and the position of each identifiable rosette is indicated by red oval (complex rosette) or green circle (simple rosette) superimposed on the cerebellar outline. Below the cerebellar profile is the vertical projection of the Neurolucida tracing to show the dorsal–ventral variations in the mossy fibre trajectory. Colour pictures show representative rosettes. Some of the complex rosettes cannot be resolved in detail due to closely packed branching. All dimensions are measured in the mounted, dehydrated tissue. The 5-μm scale applies to the simple rosettes above and below the scale bar; the 10-μm scale applies to the remaining rosettes. (B) 3-D diagram of Neurolucida mossy fibre tracing from (A). Elevated (ventral) view approximately from the position indicated by “*” in (A). Complex rosettes indicated by red symbols, simple rosettes indicated by green symbols. (C) Montage of bright field image and fluorescence picture of mossy fibre rosette patch recording in a cerebellar slice. Axon injected with Lucifer Yellow. (See also Video in Supplementary Material). (D) I–V curves for axon in (B). Inset below shows rebound depolarization following the largest hyperpolarizing pulse in (D). (E) Local, subthreshold responses (arrowheads) and spike at the beginning of depolarizing pulse in (D). Spike amplitude in (D) and (E) low-pass filtered by recording electrode. (F) Summary graph of I–V responses in (D) at steady state (circles) and at 100 ms after pulse-onset for depolarizing pulses (squares). In the hyperpolarizing direction the peak values are indicated by squares. Data points from additional sweeps are included in (F), omitted for clarity from (D). Resting membrane potential −46 mV (horizontal, dashed line); spike current threshold +100 pA (vertical, dotted line).

