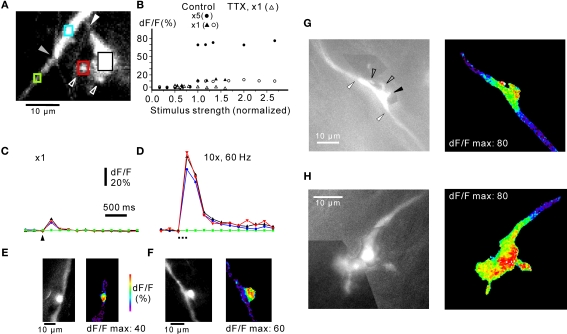
Figure 4.
Distribution of calcium signals in mossy fibre rosettes. (A) Complex rosette with large sidebranch connected to the axon via a small, narrow “neck” (white arrowhead). Small “satellite” boutons connected to the large sidebranch are indicated with open arrowheads. The transition between the axon proper (lower left) and the rosette along the axon (upper right) is indicated by the grey arrowhead. (B) Responses from rosette in (A) to extracellular stimulation with one shock (open circles) and five shocks at 50 Hz (black circles). Stimulus strength was normalized to threshold value. The same stimulus threshold was found for one shock and for five shocks. Both single and repetitive stimulations resulted in an all-or-none response, consistent with an action potential underlying the fluorescence signal. TTX (10 μM) abolished the all-or-none response (control: black triangles; TTX: open triangles). Responses with circles and triangles from two different axons. (C) Changes in fluorescence signals from rosette in (A) to a single stimulus. The regions of interest are indicated by coloured squares in (A), corresponding to the coloured lines in (C). Note locations responding with a similarly sized increase in fluorescence (rosette along the axon, blue; large sidebranch, black; satellite bouton, red), while no signal was observable over the axon (green). (D) Responses of the same locations to 10 stimuli at 60 Hz. Note the lack of response in the axon (green) and that all other locations show a robust increase in fluorescence. Frame rate in (C) and (D): 200 ms. (E, F) maximum fluorescence signals recorded from simple rosettes in response to five shocks at 50 Hz. The simple bouton in (F) was slightly offset from the axon (cf. Figure 1). Note the highly localised fluorescence signal. (G) Complex rosette en passage with small sidebranches (open arrowheads). One sidebranch projected out of the focal plane (black arrowhead). The transitions between the rosette and the axon are indicated by white arrowheads. Pseudocolour picture to the right represents maximum response to five shocks at 50 Hz. For three rosettes, stimulated with five shocks at 50 Hz, the decay from maximum dF/F at the rosette declined along the mossy fibre axon proper with a length constant of 1.7 μm, SD ± 1.1 μm. (H) Terminal complex rosette. The terminal rosette consisted of a series of enlargements along the axon, and small satellite boutons connected through fine stalks. For clarity, black-and-white pictures of complex rosettes in (G) and (H) are montages of pictures taken at different focal planes in a z-stack. Colour picture shows maximum response to five shocks at 50 Hz. Frame rate in (G) and (H) 200 ms. Responses in (C) is an average of four picture series. Experiments in (A)–(D) in 30 μM picrotoxin and 50 μM CGP55845.

