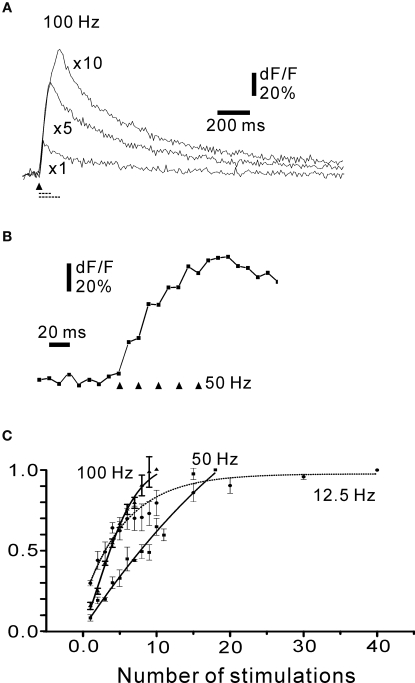
Figure 5.
Time course of rosette fluorescence signal. (A) Cumulative responses to 1, and to 5 and 10 stimuli at 100 Hz. (B) Rising phase of five stimulations at 50 Hz. Note that each stimulation resulted in a noticeable increase in fluorescence. (A, B) Simple rosette; frame rate 100 Hz. (C) Summary plot of the time course of fluorescence signals as a function of the number of stimuli at three frequencies covering most of the frequency range of turtle mossy fibres. Symbols: square: 12.5 Hz; triangle: 50 Hz; circle: 100 Hz. The curves were normalized to the maximum response for each frequency: note for instance, that the actual maximal response (as dF/F) for 12.5 Hz would be lower than for 50 and 100 Hz. Each point is the average of at least four axons. All responses in (A)–(C) obtained in the presence of 30 μM picrotoxin and 50 μM CGP55845. Traces in (A), (B) and responses in (C) are averages of four picture series.

