Figure 6.
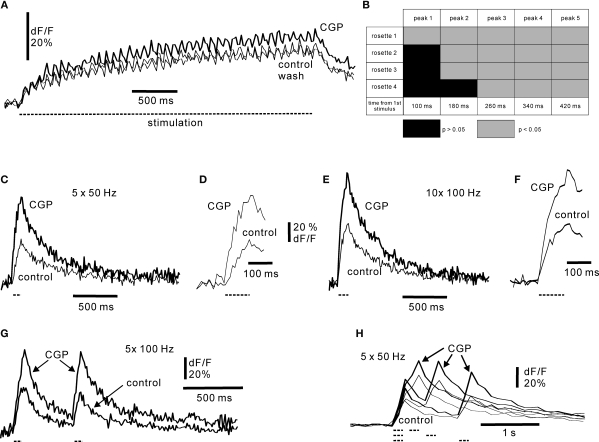
Responses of mossy fibre rosettes to GABA B receptor activation. (A) Repetitive activation of mossy fibre with 12.5 Hz in control medium, in CGP55845 (50 μM) and following wash of CGP55845. Duration of stimulus train is indicated by dashed line below the sweeps. Each trace is the average of four picture series. Simple rosette. Frame rate 50 Hz. (B) Time course of onset of GABA B activation at 12.5 Hz for four axons. For each mossy fibre stimulation the peak fluorescence values of the four controls were compared with the four peak values obtained in CGP55845. Non-significant differences are indicated by black, and significant differences (p < 0.05) are indicated by light grey. Note that all axons showed significant GABA B inhibition after the third stimulus, ∼260 ms. (C) Response to 50 Hz stimulation, five shocks. (E) Response to 100 Hz stimulation, 10 shocks. (D, F) Show the onsets of stimulation at an expanded time scale: note that control responses and responses in CGP55845 diverged early, indicating a rapid onset of GABA B receptor activation in control. Duration of the stimulus train is indicated by dashed line below the trace. (G) Paired-pulse stimulation of mossy fibres at 100 Hz. Note the large effect of CGP55845 on the first burst. (H) Duration of paired-pulse depression examined by varying the inter-burst interval from 200 ms to 1 s. Each burst consisted of five shocks at 50 Hz; the duration and occurrence of the bursts are indicated below the figure by dashed lines. All experiments in 30 μM picrotoxin. CGP55845 concentration: 50 μM. Frame rate (C) and (H): 50 Hz; (E–G): 100 Hz.

