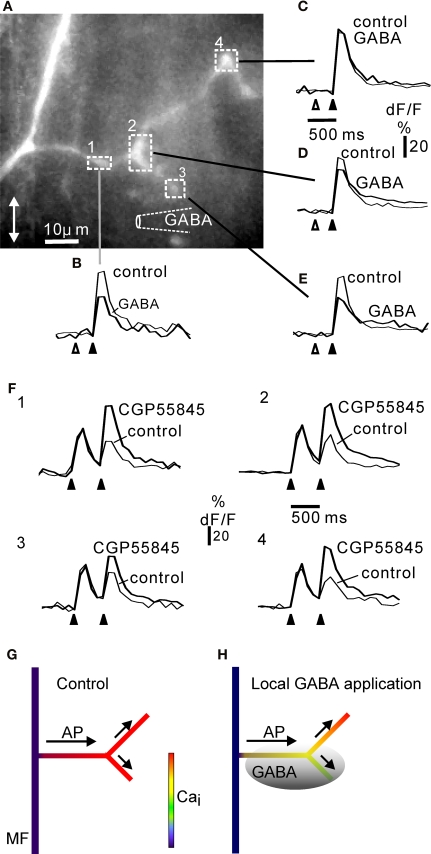
Figure 7.
Local inhibition of calcium signalling in complex rosettes by focal activation of GABA B receptors. (A) Complex rosette branching off a mossy fibre axon (cf. Figure 1). The position of the GABA pipette is indicated diagrammatically. For each region of interest indicated by the square boxes 1–4, the fluorescence signals to five electrical stimuli at 50 Hz (black arrowhead below dF/F traces) are shown as control and 300 ms after a GABA puff (open arrowhead). Each trace is the average of at least three trials. In location 4 (C), GABA had no effect, whereas in location 1–3 (B), (D, E) prior GABA application depressed the fluorescence response to subsequent electrical activation. The results suggest that proximal regions affected by GABA (1, 2) did not prevent the action potentials from propagating to more distal regions (4, (C)) unaffected by GABA. All regions showed a CGP55845-sensitive paired-pulse depression at inter-burst intervals of 500 ms (F), 1–4; panel numbers correspond to regions in (A). The rosette was confined to the side branches: the axon showed no fluorescence signal increase, while the whole extent of the side branches gave a fluorescence response to electrical stimulation, similar to other complex rosettes shown. The size of this rosette was comparable to the lateral extent of rosettes in fixed and dehydrated tissue (Figure 1). In other experiments (not shown) similar results were obtained in complex rosettes along the axon: local GABA application at one end of long rosette (cf. Mugnaini et al., 1974) resulted in local reduction in electrically-evoked fluorescence signals near the GABA-containing pipette. GABA pipette puff duration: 25 ms. Frame rate 10 Hz. CGP55845 concentration: 50 μM. All experiments in 30 μM picrotoxin. Double-headed arrow in (A) indicates the cerebellar sagittal direction. (G) Summary diagram of widespread calcium signal in control situation (no GABA application prior to electrical stimulation of mossy fibre), cf. panels (B–E). (H) Diagram of local GABA application prior to electrical activation (shaded grey; cf. panels (B–E)) reducing the calcium signal from some branches of the complex rosette. The depolarization, e.g. an action potential (AP), spreads (arrows) from the parent mossy fibre (MF) through rosette branches with calcium signals inhibited by local GABA B receptor activation, to branches showing no GABA B effect.

