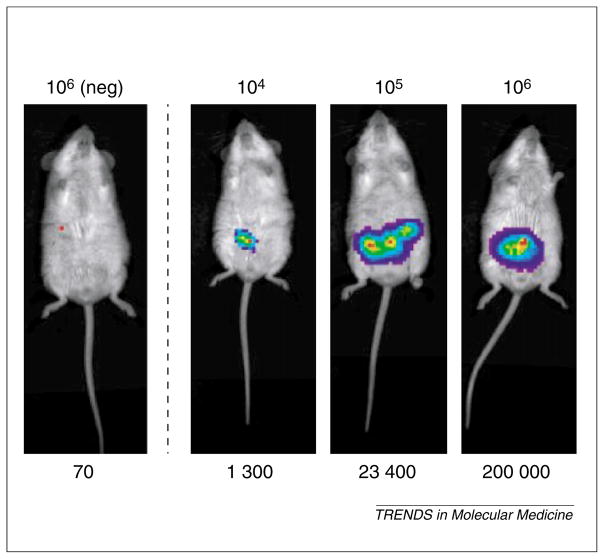
Figure 3.
Estimation of the sensitivity of optical imaging. Prostate cancer cells, LNCaP, were infected by recombinant adenovirus expressing FL driven by CMV promoter (AdCMV-FL) at MOI 10. Two days after infection, cells were harvested and resuspended in 50 μl sterile phosphate-buffered saline + 50 μl Matrigel (BD Biosciences), and injected intra-peritoneally. On the same day of cell implantation, mice were imaged in Xenogen IVIS charged coupled device camera after administration of 200 μl D-luciferin substrate (15 mg/ml). Optical signal intensity (listed below images in relative luminescent units per min of acquisition, RLU/min) is roughly proportional to the number of AdCMV-FL-infected cells (listed above the images). The negative control cells were infected with AdCMV-TK.

