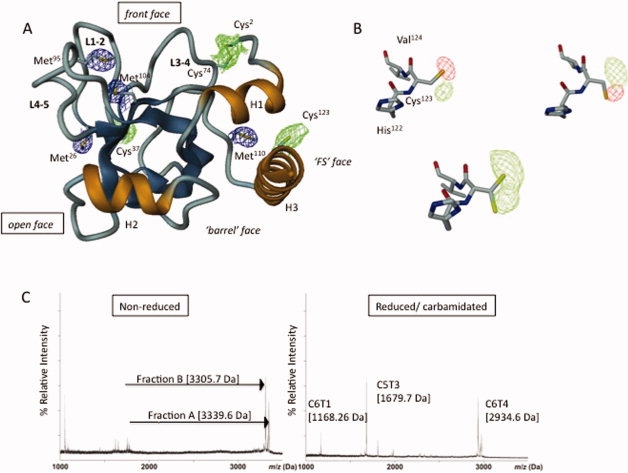
Figure 1.

Long-wavelength X-ray structure of NtA and MS mapping of the interdomain disulfide linkage. (A) Ribbon diagram of the NtA structure. The β-strands are in blue and α-Helices (H1-H3) are in gold; loops L1-2, L3-4, and L4-5 connecting individual β-strands strands are oriented to the same surface of the protein. The 4σ Fo-Fc electron density maps for individual sulfur atoms in methionine thioether groups (in blue) and cysteine thiol moieties (in blue) are highlighted. (B) The alternate conformations adopted by Cys123. Upper row: calculated Fo-Fc electron density map (4σ contour level) around Cys123 is indicated each by means of the positive (green) and negative (red) electron density peak. The diffraction data were measured at λ = 1.54 Å. Lower row: a 4σ contour level Fo-Fc difference map (diffraction data collected at 1.6995 Å) indicating the free degree of rotation at κ angle at the thiolgroup of Cys123. (C) Left panel: MALDI-TOF spectrum of nonreduced fractions A (3339.6 Da) and B (3305.7 Da) obtained by sequential cleavage of NtA-FS by CNBr and trypsin. Right panel: the corresponding MALDI-TOF spectra of reduced and carbamidated trypsin digests of fraction A (C5T3 and C6T1) and B (C6T4). [Color figure can be viewed in the online issue, which is available at www.interscience.wiley.com.]
