
Figure 3.
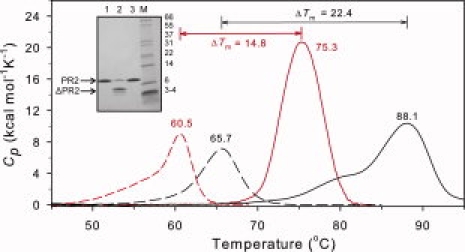
DSC thermograms for PR2 (red) in the absence (dashed lines) and presence (solid lines) of an approximately twofold molar excess of DRV in 20 mM sodium phosphate buffer, pH 6.0, 50 mM NaCl, compared with PR1 (black) in 50 mm sodium acetate, pH 4.8. Data for PR1 are from Ref. 26. For further experimental details, see text. The inset shows SDS-PAGE of PR2 before (lane 1) and after (lane 2) a DSC scan at pH 5.0, showing extensive autoproteolysis in the absence of inhibitor. As expected, a DSC scan of PR2 performed in the presence of an approximately twofold excess of DRV (lane 3) does not result in autoproteolytic degradation of the protein.