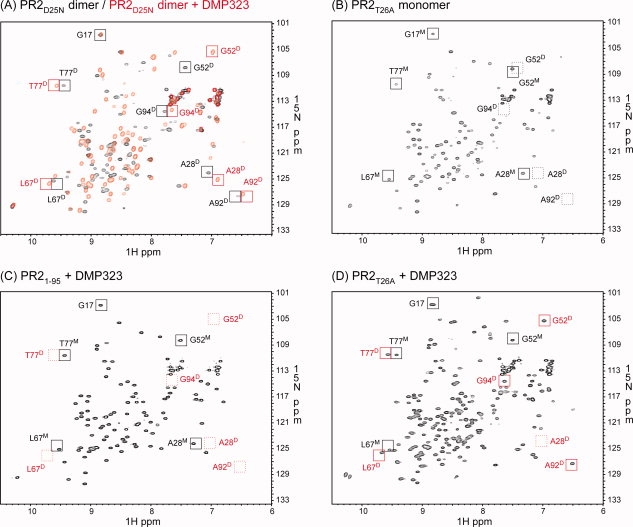
Figure 6.

1H-15N HSQC spectra acquired for (A) PR2D25N in the absence (black) and presence (red) of DMP323, (B) PR2T26A, (C) PR21-95 in the presence of DMP323 and (D) PR2T26A in the presence of DMP323. Proteins were folded as described in “Materials and Methods” in 50 mM sodium acetate buffer, pH 5, containing 50 mM NaCl, with final concentrations of 150–200 μM dimer (A) and 82–110 μM monomer (B-D). Tentative signal assignments are shown for spectra in panels (A) and (B) and compared with (C) and (D). The spectrum of PR21-95 in the absence of DMP323 is not shown, because it was identical to that in the presence of DMP323. Black and red squares indicate positions of signals in the absence and presence of DMP323, respectively. Dashed squares indicate positions of characteristic peaks that are not observed. Superscripted D and M beside the residue number denote dimer- and monomer-specific signals, respectively.
