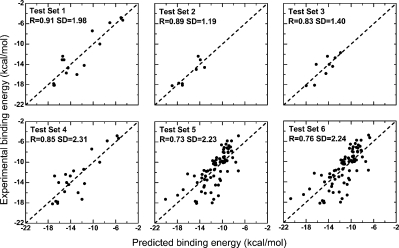
Figure 2.

The predicted binding affinity by improved approach fitting with experimental data for six test sets. The linear correlation coefficient (R) and standard deviation (SD) were calculated. The results of the statistical analysis are given in Table I.
