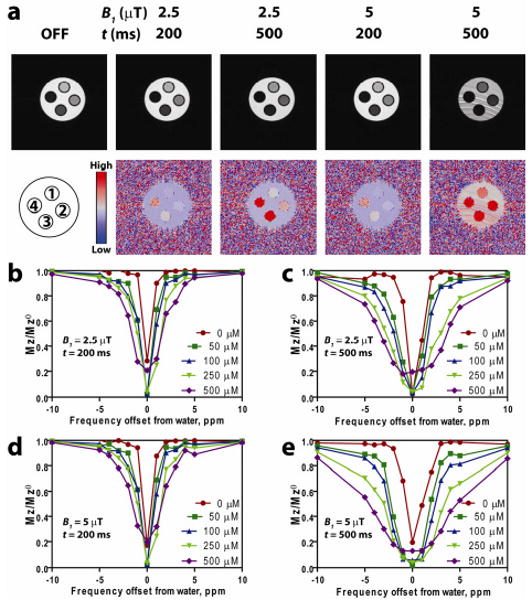
Fig. 2.

(a) Images collected using the indicated pre-saturation pulse power and duration (top), and their corresponding ORS images obtained by taking a division of an OFF image with an ON image RF-irradiated at 2 ppm offset. (b-e) Z-spectra of SPPM phantoms at different saturation powers and durations. (b) 2.5 μT, 200 ms, (c) 2.5 μT, 500 ms, (d) 5 μT, 200 ms, and (e) 5 μT, 500 ms. Iron concentration in SPPM phantoms are as follows: 1 = 50 μM, 2 = 100 μM, 3 = 250 μM, 4 = 500 μM. The SPPM phantoms are surrounded by water.
