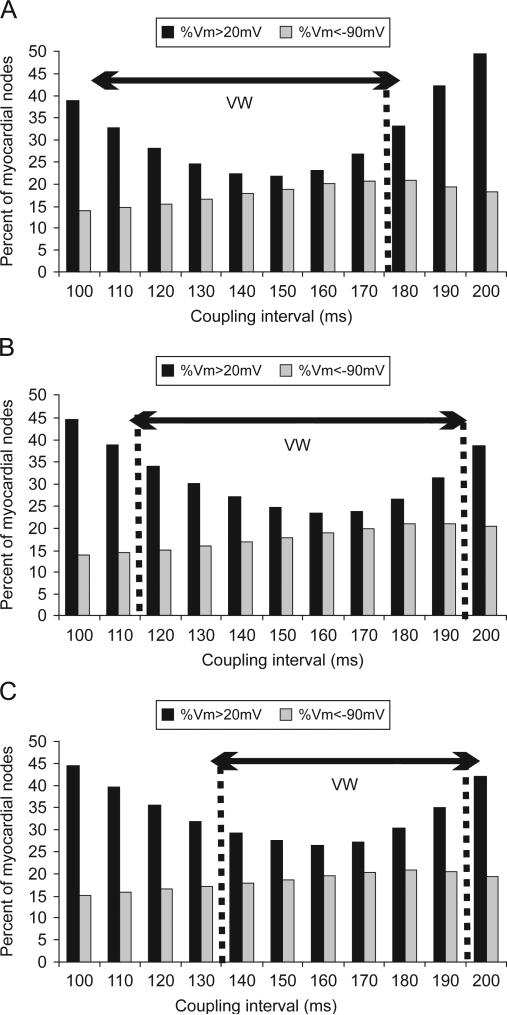
Fig. 6.
Percentage of myocardial nodes that are of transmembrane potential above +20 mV (black bars) and below –90 mV (grey bars) at the end of a 11.43 V/cm shock applied at CIs in the range of 100–200 ms in the homogeneous model (panel A), the heterogeneous model (panel B), and the heterogeneous model with sub-epicardial uncoupling (panel C).

