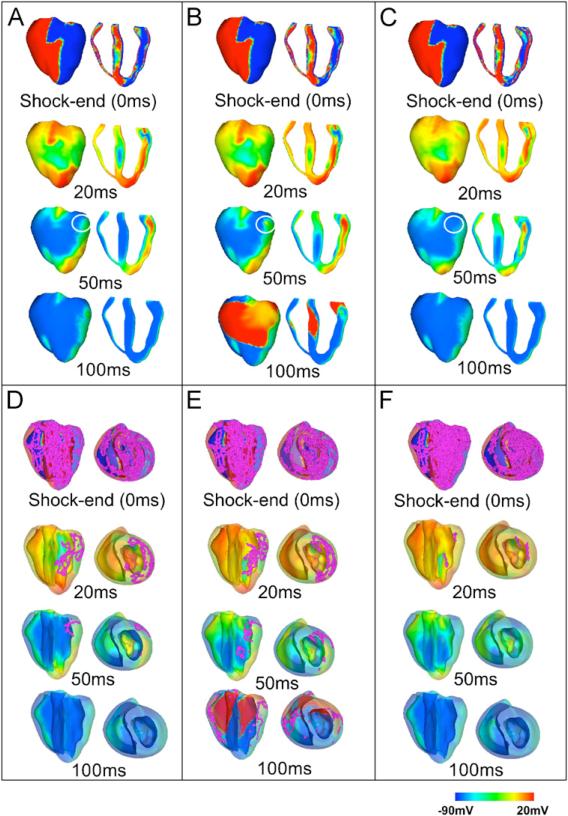
Fig. 8.
Transmembrane potential and filament distributions at shock-end (0 ms panels) and at 20, 50 and 100 ms following a 30.5-V/cm shock applied at a CI of 140 ms to the homogeneous ventricles (panels A and D), to the heterogeneous ventricles (panels B and E), and to the heterogeneous ventricles with sub-epicardial uncoupling (panels C and F). Panels A–C show anterior epicardial and transmural views. In panels D–F, the epicardial surface has been rendered semi-transparent to allow visualisation, in pink, of scroll-wave filaments. Colour scale is saturated, i.e. transmembrane potential above 20 mV and below –90 mV appear red and blue, respectively. Arrows indicate the direction of propagation, and circles denote the presence or lack thereof of a local wavefront on the epicardial surface at 50 ms post-shock.

