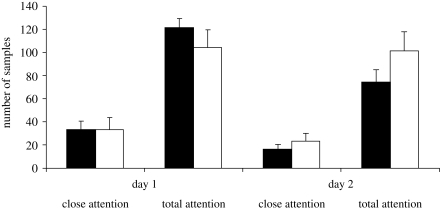
Figure 3.
Mean amounts of ‘close’ and ‘total’ attention paid to the screen (+s.e.m.) on the two testing days. Half of the chimpanzees saw the yawn stimulus and half saw the control on day 1, and the order was reversed on day 2. There are no significant differences for any of the comparisons (independent samples t-tests: day 1, close attention t21 < 1.0 n.s.; day 1, total attention t21 < 1.0 n.s.; day 2, close attention t21 < 1.0 n.s.; day 2, total attention t21 = 1.35, p = 0.19). Black bars, yawn; white bars, control.

