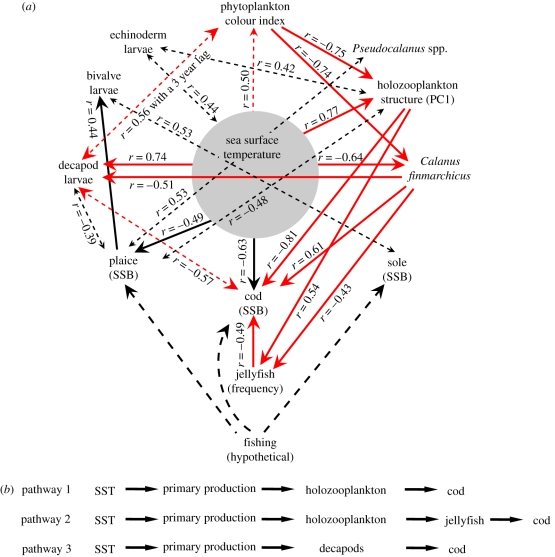
Figure 2.
Statistical causal modelling to determine the pathways by which temperature propagates through the North Sea food web. (a) Causal model based on the examination of both ordinary and first-order partial coefficients of correlation between 12 variables. Only significant ordinary coefficients of correlation (p < 0.05) are indicated on the diagram. Unidirectional solid arrows indicate a statistical causal link between variables with an indication of direction. Bidirectional dashed arrows indicate a correlation between variables without direction. Red arrows indicate pathways contributing to the trophic amplification of temperature effects with respect to cod. Note that the red arrow between sea surface temperature (SST) and phytoplankton is shown dashed as the analysis did not indicate direction in this case. However, we consider it unlikely that phytoplankton influences SST over the timescale of our study. Black, unidirectional, dashed arrows suggest the top-down effects of fishing. (b) Three indirect pathways leading to the trophic amplification of temperature on cod.

