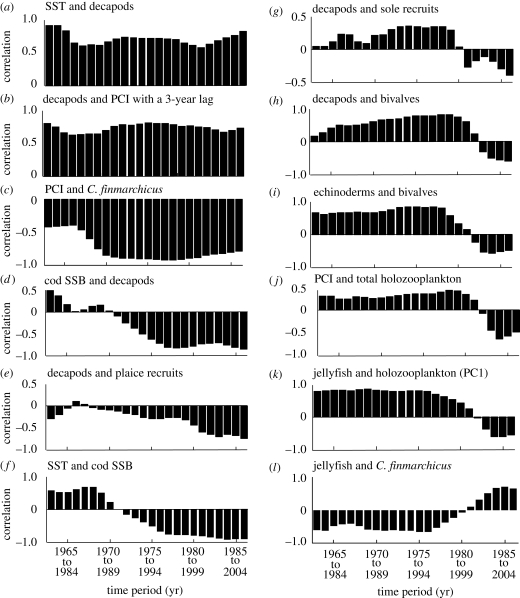
Figure 4.
Sliding correlation analysis between pairs of variables for the period 1958 to 2005. (a) sea surface temperature (SST) and decapods. (b) Decapods and phytoplankton colour index (PCI) with a three-year lag. (c) PCI and C. finmarchicus. (d) Cod SSB and decapods. (e) Decapods and plaice recruits. (f) SST and cod SSB. (g) Decapods and sole recruits. (h) Decapods and bivalves. (i) Echinoderms and bivalves. (j) PCI and total holozooplankton. (k) Jellyfish and holozooplankton (PC1). (l) Jellyfish and C. finmarchicus. Each vertical bar represents a 20 year period, for example, the first three vertical bars represent the overlapping periods 1963 to 1982, 1964 to 1983, and 1965 to 1984, respectively. Consequently, in the axis labels, the upper and lower years denote the beginning and the end of the time period, respectively.

