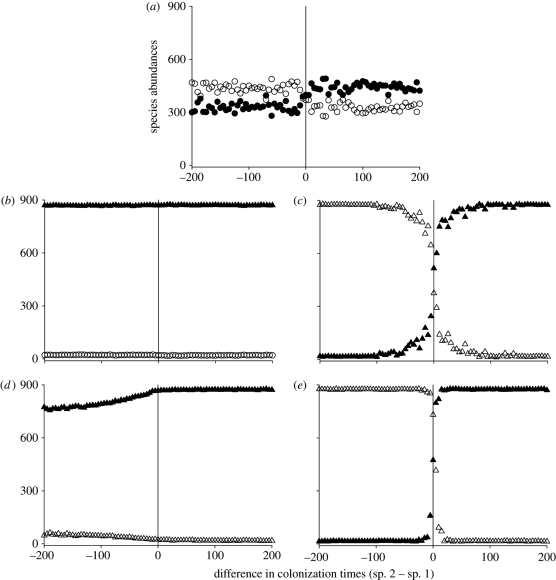
Figure 2.
The mean final abundances (n = 100 simulations) of two initially neutrally competitive species differ depending on their colonization times and adaptive potentials. In each subpanel, the bottom axis describes the difference in times of introduction between the two species. At the central vertical line, both species colonize the new habitat at the same time. To the left of this line, species 2 was introduced before species 1 (negative values). To the right of this line, species 1 was introduced before species 2 (positive values). (a) Neither species evolves. Each species dominates when they colonize the habitat before the other, but this priority effect is not very strong. Black circles, species 1; white circles, species 2. (b,c) Evolution occurs through mutation and (d,e) through standing genetic variation. (b,d) Species 1 (black symbols) evolves, whereas species 2 (white) does not. The evolving species dominates across the range of colonization times. (c,e) When both species evolve, each species dominates the patch when introduced earlier than the other, and this dominance is strongly augmented by evolution-mediated priority effects. Black triangles, evolving species 1; white triangles, evolving species 2. Parameter values follow those indicated as baseline in electronic supplementary material, table S1.

