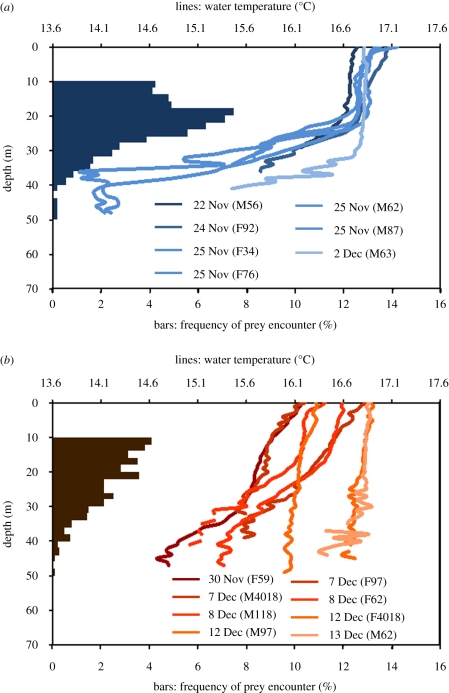
Figure 2.
Temperature profiles (lines) of the water masses around Phillip Island, Australia, recorded by miniature bio-loggers attached to foraging little penguins. Note the clear thermal stratification of the water in (a) 2005 (with a thermocline around 20–25 m), compared with the situation in (b) 2006, a weak El Niño year (see text). Bars indicate the distribution of those depths where penguins encountered prey (bars at 0–10 m are not represented as the index of prey encounter at these depths is influenced by biomechanical factors related to the buoyancy of the animal).

