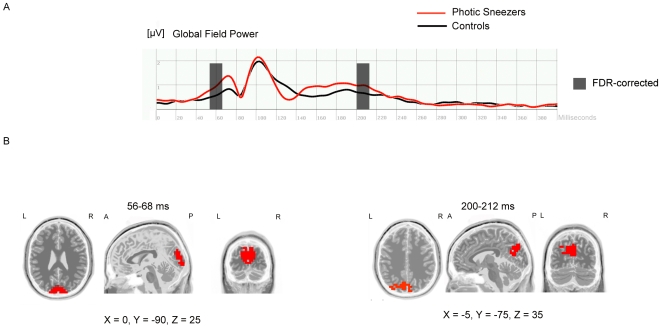
Figure 1. Comparing photic sneezers with control subjects.
(A) Visual event-related potential (global field power) 0–400 ms after stimulus onset of block1 (checkerboard-paradigm) for both groups (photic sneezers vs. controls). Two time segments at 56–68 ms and 200–212 ms after stimulus presentation survived the FDR-correction (p<0.05). These time segments are marked by transparent rectangles. (B) sLORETA-analysis of the FDR-corrected time segments revealed significantly increased activity of the photic sneezers compared with control subjects. Neural generators for the time segment 56–68 ms are located in the primary visual cortex. The increased activation for the time segment 200–212 ms was found in the secondary visual cortex. Cortical activation differences estimated with sLORETA are displayed in red. X, Y, Z MNI-coordinates of the local maximum of the activation difference.

