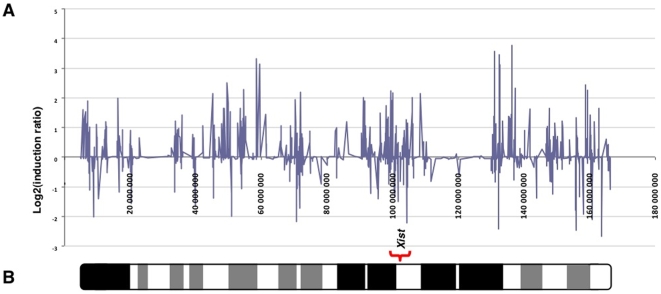
Figure 6. Expression profile of gene expression ratios between in vitro cultured embryos and controls on the X-chromosome do not show a clusterization near the Xist gene.
A. Induction ratios (log2) of genes according to their position on the sequence of X-chromosome in the IVF samples. B. Ideogram of Mus musculus X-chromosome and localization of Xist gene.

