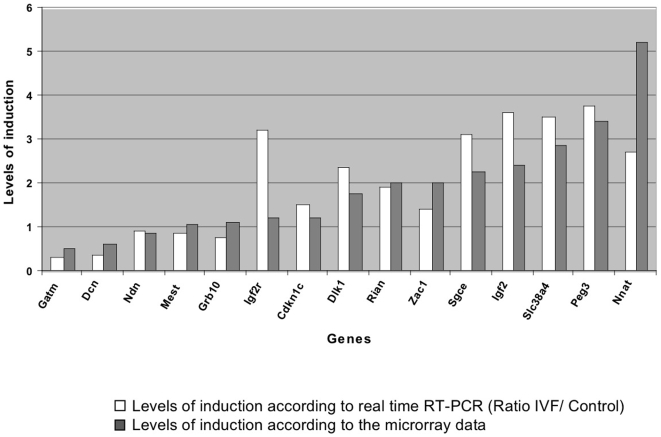
Figure 7. Comparison of levels of induction for 15 genes between real time RT-PCR and microarrays data.
Comparison of induction ratios between qRT-PCR and microarray data. The PCR primers were chosen at positions corresponding to Affymetrix features for analysis by qRT-PCR. As clearly shown, there is a very good correlation of the results between the two approaches.

