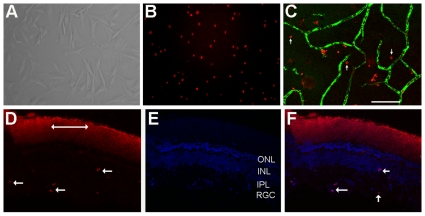
Figure 5. Distribution of MSCs.
A. phase contrast microphotograph of bone marrow derived mesenchymal stem cells at passage 2. B. MSCs were preincubated with PKH26 before intravenous injection. C. PKH26 labeled MSCs in the retina two weeks after intravenous injection (arrows); blood vessels were perfused with FITC-dextran (green). D–F. showing PKH26 labeled MSCs in the retinal section (D, arrows pointing PKH26 labeled MSCs; double arrows indicating background staining in debris zone); sections counterstained with DAPI (E); F. merged image from D&E showing PKH26 labeled MSCs counterstained with DAPI (scale bar equals 100 µm).

