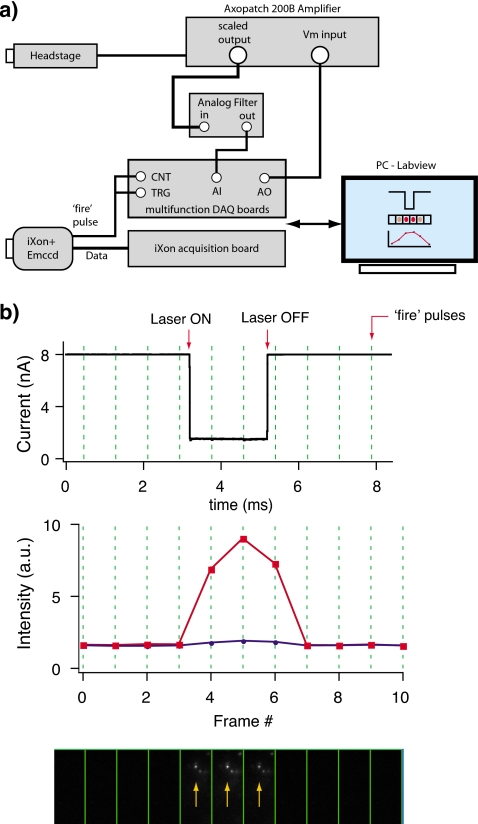
Figure 2.
(a) A block diagram depicting the hardware setup for synchronizing the EM-CCD data stream with the A∕D sampling of the ion-current signal. Headstage of Axopatch 200B amplifier measures ionic current, whereas the EM-CCD camera records images. Both measurements are synchronized by using the fire pulse to trigger start both current and image acquisition (see text). (b) Synchronization test of the electrical and optical signals. Top panel shows the current acquisition of a current pulse from a function generator, coupled to the Axon 200B headstage, which simulates an “event.” The same pulse is used to switch ON∕OFF the excitation laser (arrows). Synchronization is achieved by recording accurate time stamps using a DAQ board, generated by the EM-CCD fire pulses at 1 KHz rate (marked by vertical dotted lines). To test the system fluorescent beads were immobilized on the SiN membrane. A typical set of images during an event (bottom panel) and the extracted intensity at the bead position (red, squares) and at a background spot (blue, circles) are shown. The arrows in the bottom panel indicate the bead used for this analysis.

