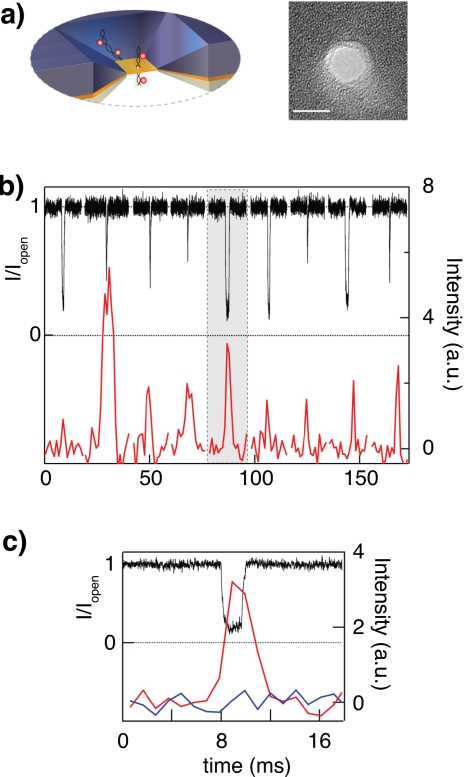
Figure 4.
Synchronous electrical and optical signals from DNA molecules during translocation through a 4 nm solid-state nanopore. (a) Schematic illustration of labeled dsDNA molecules threaded through a 4 nm nanopore (TEM image displayed on right panel). (b) A typical set of translocation events of 421 bp PCR segment, each labeled randomly with ∼5 Alexa647 dyes. Normalized current blockades (black lines) and fluorescence intensity measured at the pore position (red lines, background corrected) are overlaid. Events are spaced 20 ms for display purposes. (c) A magnified view of the highlighted event (gray background in panel b), also displaying the fluorescence background (blue line, measured on a pixel ∼3 μm away from the nanopore).

