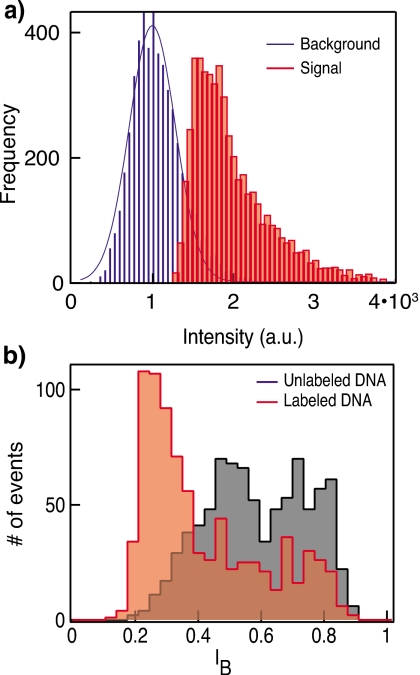
Figure 5.
(a) Optical detection and (b) electrical detection distributions measured using labeled (red, filled rectangles) and unlabeled (black) DNA translocations. The distributions of synchronous optical measurements of DNA-AL647 translocations showing multiple populations. Histogram shows intensity in images at a 3×3 pixel area centered at nanopore and at a randomly chosen background position (blue, lines). Optical intensities are baseline corrected for the EM-CCD readout noise.

