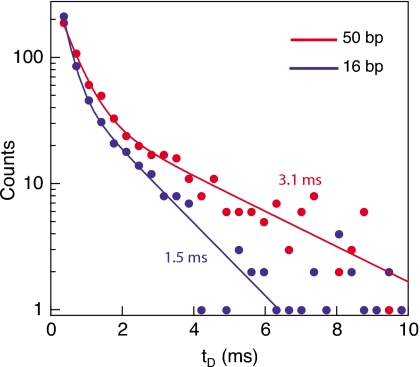
Figure 7.
Dwell time distributions (measured from the electrical signals) of the avidin-DNA complex with a 50 bp duplex region (red, top curve) or a 16 bp duplex region (blue, bottom curve). Lines represent double-exponential fits to the histograms. We observe a twofold increase in the longer timescale for the 50 bp duplex as compared with the 16 bp duplex (3.1±0.3 and 1.5±0.1 ms, respectively).

