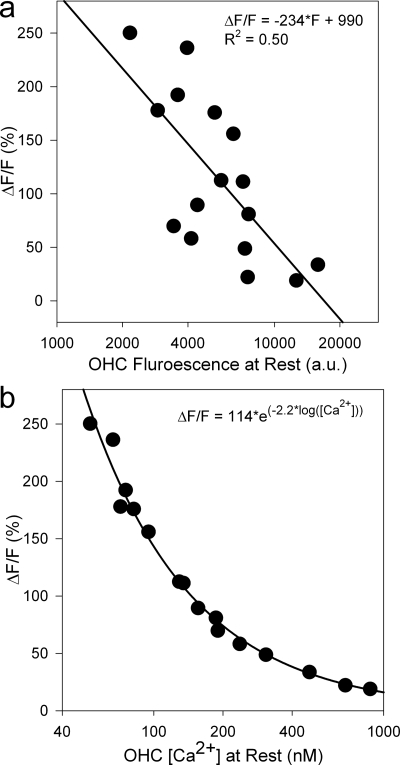
Figure 5.
Change in fluorescence after membrane permeablization vs the initial OHC fluorescence. OHCs that were initially dimmer demonstrated a larger increase in their fluorescence as expected. Data were fitted with a line. (b) Change in fluorescence after membrane permeablization vs the initial OHC [Ca2+]. Data were fitted with an exponential curve. Three data points at the extreme high range were >2 SD above the mean, and were excluded from the calculations of the average resting OHC [Ca2+].

