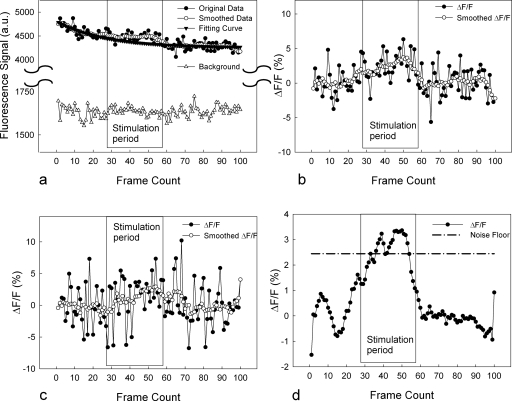
Figure 6.
Original data, smoothed data, and exponential fit, as a function of time (frame counts) from a group of 24 OHCs. The smoothing method was a moving window average with a nine-point span. The fit was a single exponential curve, excluding data during the time of the sound stimulus. Sound stimulation was presented between frames 27 and 58, as indicated by the rectangle. Background noise was not affected by photobleaching or the sound. (b) Original data and smoothed data after normalization to the exponential fit for the data shown in (a). (c) Representative response from a single OHC. (d) Average of responses from ten OHCs from six different cochleae. The noise floor threshold shown is 3 SD above average.

