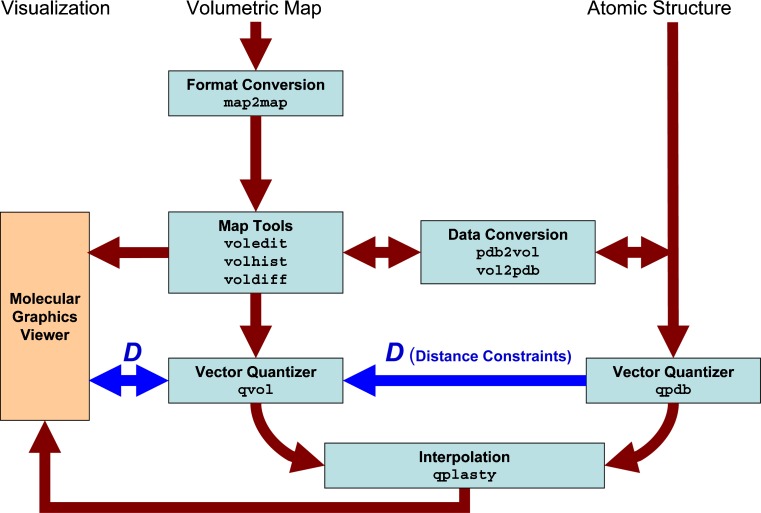
Fig. 5.
Schematic diagram of flexible fitting with Situs 2.5. The modeling of distance constraints for the MCN is shown in dark blue. Standard volumetric map formats are converted with the map2map utility and the data can be prepared for coarse graining by vector quantization using a variety of map visualization and analysis tools. Atomic coordinates in PDB format can be transformed to low-resolution maps, if necessary, and vice versa. During vector quantization of the high-resolution structure, distances can be learnt that are sent to the vector quantizer of the low-resolution structure to enable MCN-based fitting. After the vector quantization, the high-resolution structure is flexibly docked by the qplasty tool (Rusu et al. 2008). As an alternative to spatial interpolation with qplasty, a molecular dynamics refinement is also supported

