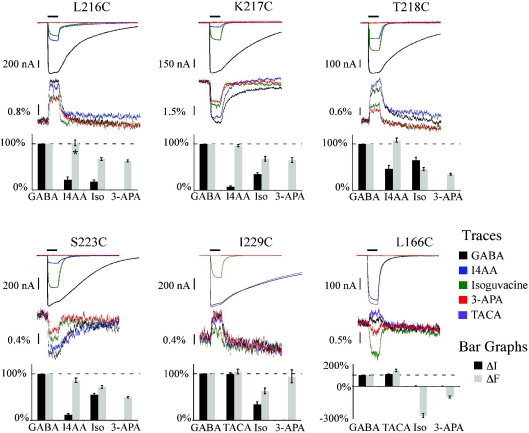
Figure 3.
Correlation of agonists (GABA and TACA), partial agonists (I4AA and isoguvacine), and a competitive antagonist (3-APA) induced ΔI and ΔF for residues L216C, K217C, T218C, S223C and I229C of Loop F as well as L166C of Loop E The top panel shows the ligand-induced currents with the corresponding ΔF below. The bar graphs depict the ΔI (grey) and ΔF (black) normalized to GABA for each residue. In general, there was no clear correlation between the fluorescence and the functional effects of the ligand. Reproduced from Khatri et al. (2009) with permission from Elsevier.

