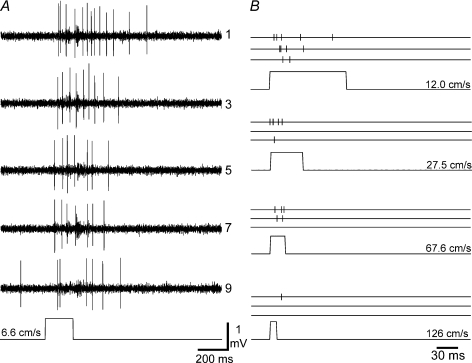
Figure 2. Responses to brushing stimuli.
A, raw responses from a typical ‘wide dynamic range’ lamina I spinoparabrachial neuron to repeated brushing at the lowest velocity tested (6.6 cm s−1). The first, then every other response to a series of 10 stimulus repetitions are shown. A marker trace (bottom) from a photocell indicates stimulus timing. As can be seen, there is a gradual reduction in response as the stimulus is repeated, similar to primary afferent C-fibre mechanoreceptors. B, responses of the same cell to 4 other of the 10 different brush velocities that were tested. Responses to the 1st, 5th and 10th stimuli are shown, with each action potential represented by a vertical tick mark. As can be seen, increasing stimulus velocity caused a progressive reduction in response.

