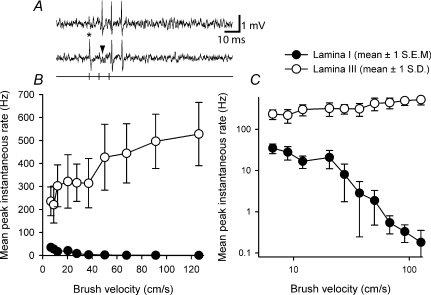
Figure 4. Differentiation of the low-threshold inputs to lamina I neurons from low-threshold inputs to lamina III neurons.
A, raw responses from a single lamina III spinoparabrachial neuron showing collision of the first antidromic impulse in a train of 3 (150 Hz, upper trace) when an orthodromic impulse (asterisk, lower trace) occurred within the critical interval. The arrowhead indicates the point at which the first antidromic response should have occurred. B, stimulus–response curves from the population of lamina I neurons and the single ‘wide dynamic range’ lamina III neuron to graded velocity brushing. Note how evoked discharge increases for the lamina III neuron. C, same data as in B but transformed logarithmically.

