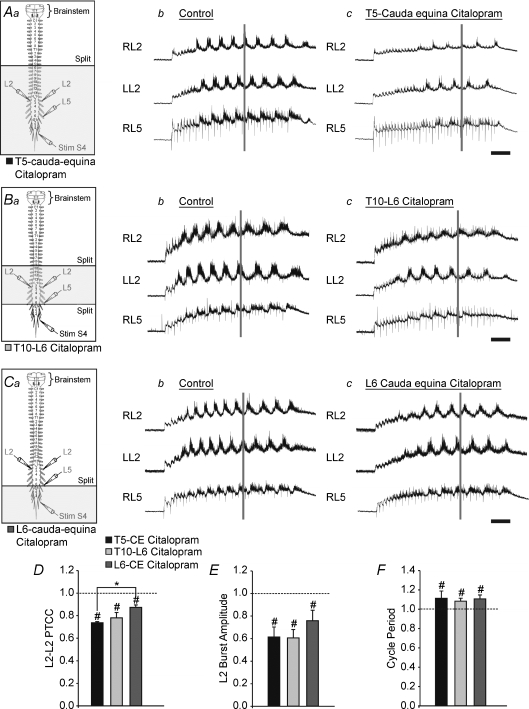
Figure 4. The effect of citalopram is not dependent on the mode of activation of the CPG and is partially determined by the site of application.
Aa, Ba and Ca, schematic diagrams of the isolated brainstem–spinal cord preparation. The horizontal lines labelled ‘split’ represents the locations of the petroleum jelly barrier which isolates the rostral portion of the cord from the caudal. The shaded area represents the portion of the spinal cord exposed to citalopram. The legend with the colour coded box underneath each schematic diagram corresponds with the colours of the bar graphs. a–c, raw traces with stimulus artifacts digitally attenuated. A, raw traces under control conditions (b) and 30 min after citalopram application caudal to T5 (c), with the petroleum jelly split at T5. B, raw traces under control conditions (b) and 30 min after citalopram application to the lumbar compartment (c), with the petroleum jelly split at L6. D–F, graphs comparing the decrease in the PTCC (D), the change in the L2 burst amplitude (E), and the change in the cycle period (F). Error bars represent the standard error of the mean. #Significant change from control, *significant difference across location of application (both P < 0.05) as measured by a two-way repeated measures ANOVA. Scale bar = 2 s.

